DE · EN
Data Tool · R-Shiny Application

The Compass.

An interactive lithium database: maps, valuations and metrics for all relevant projects and companies worldwide — dynamically filtered, transparently calculated.

To the Tool →
Opens the live R-Shiny application
Loading the tool will fetch map tiles from OpenStreetMap (UK) — your IP address will be transmitted to the OpenStreetMap Foundation. Details in the Privacy Policy.
01 · World Map & Dashboard

The whole sector
on one map.

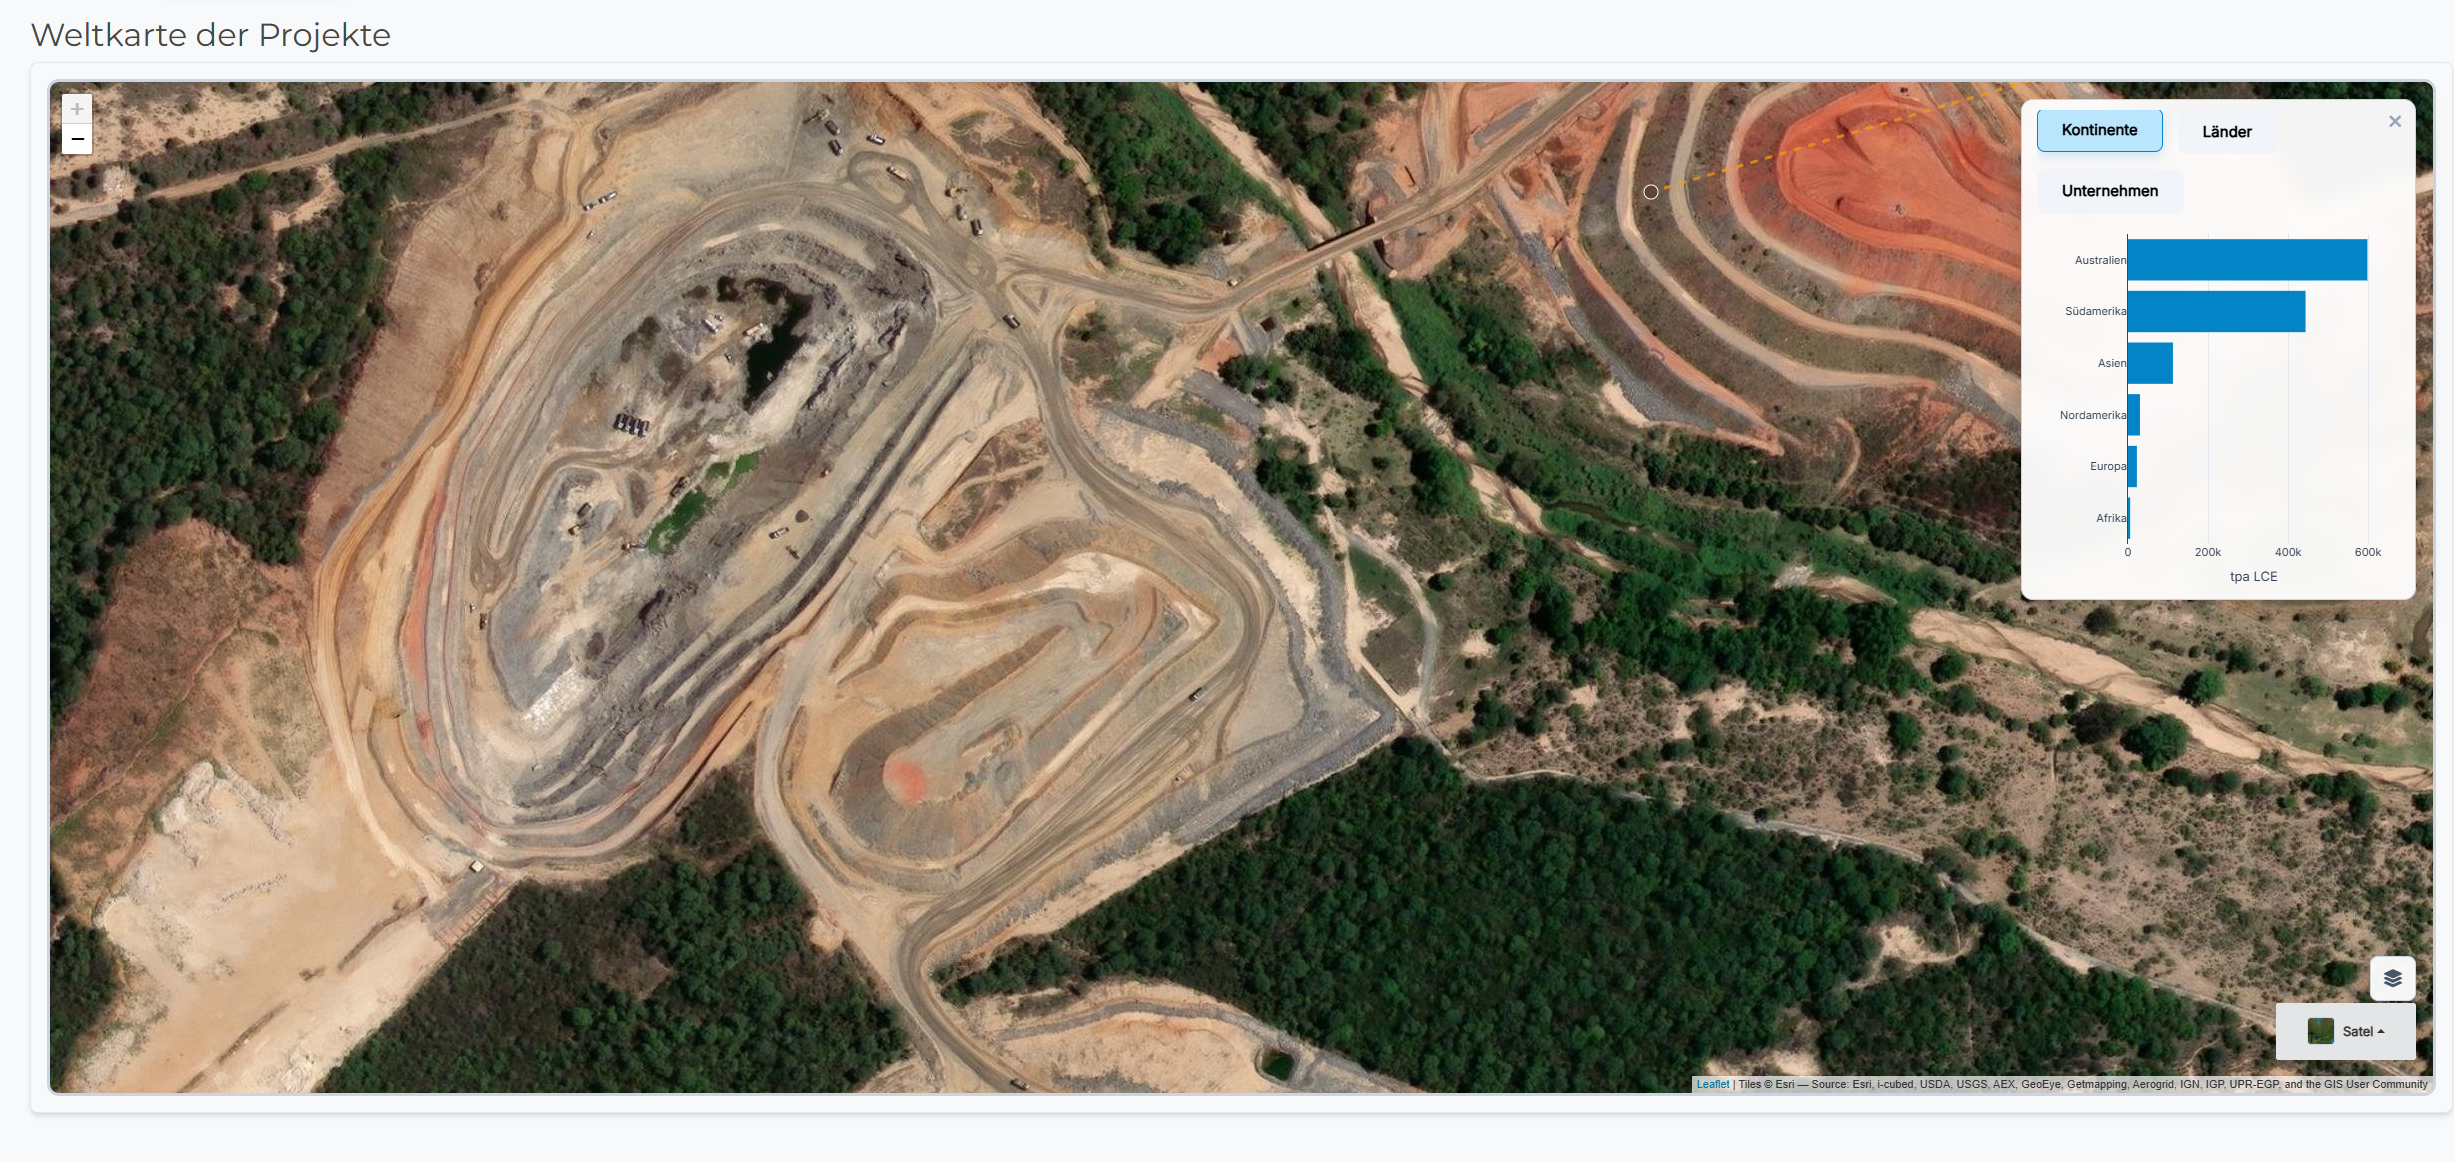
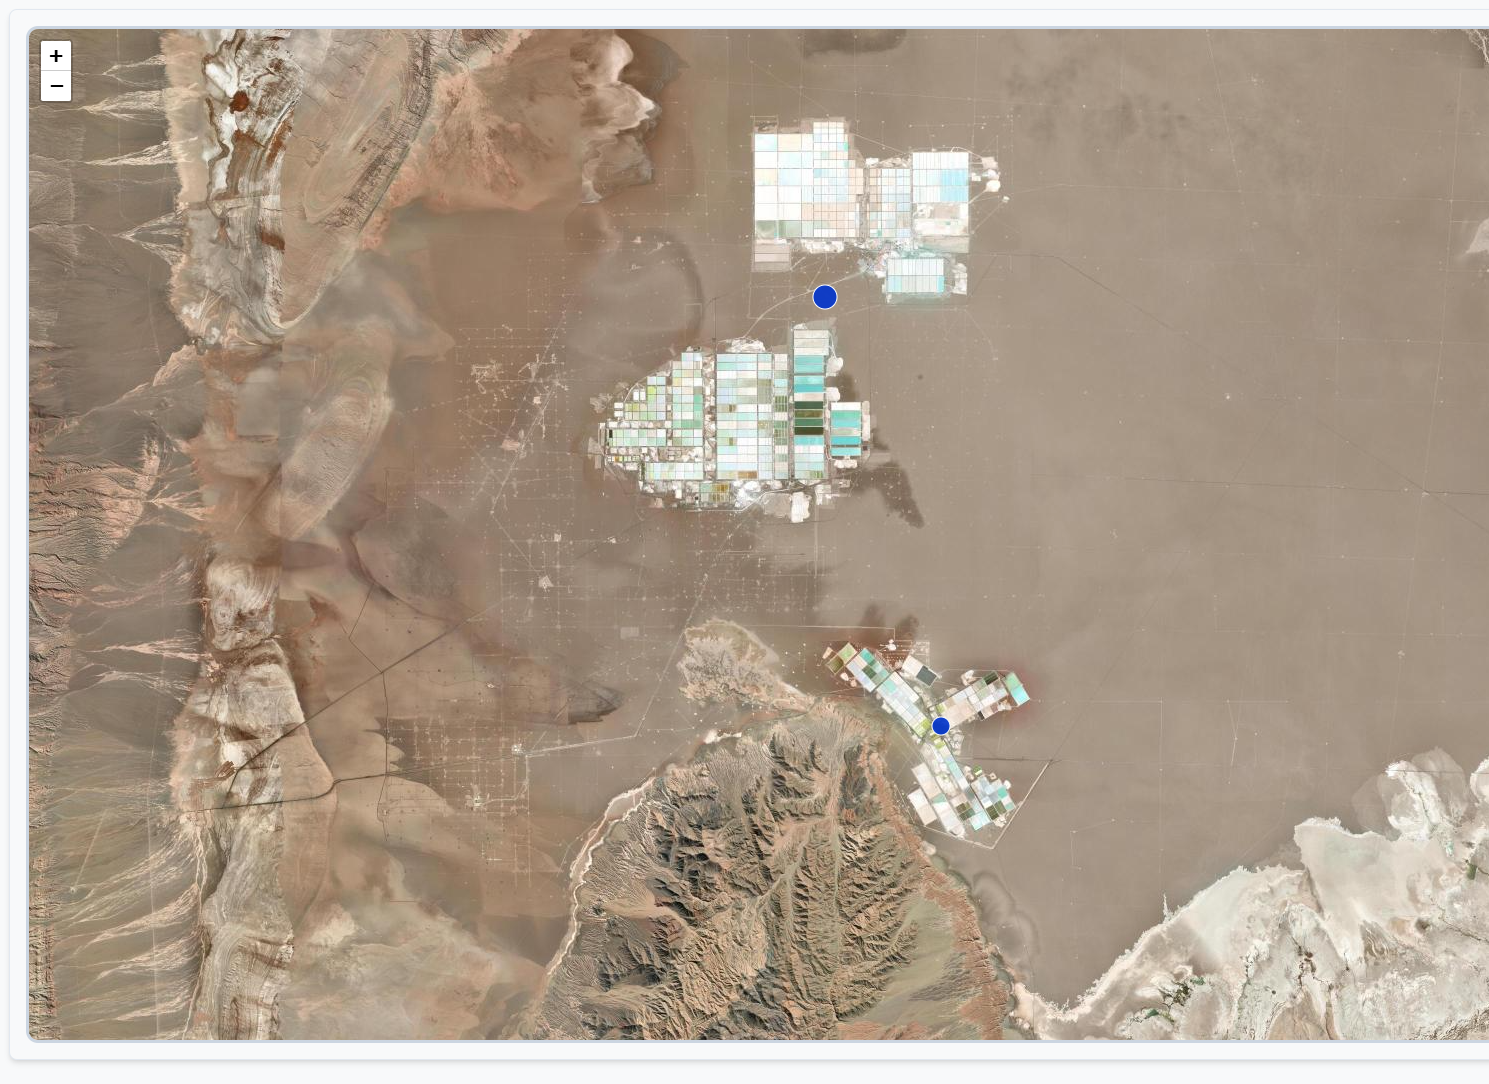
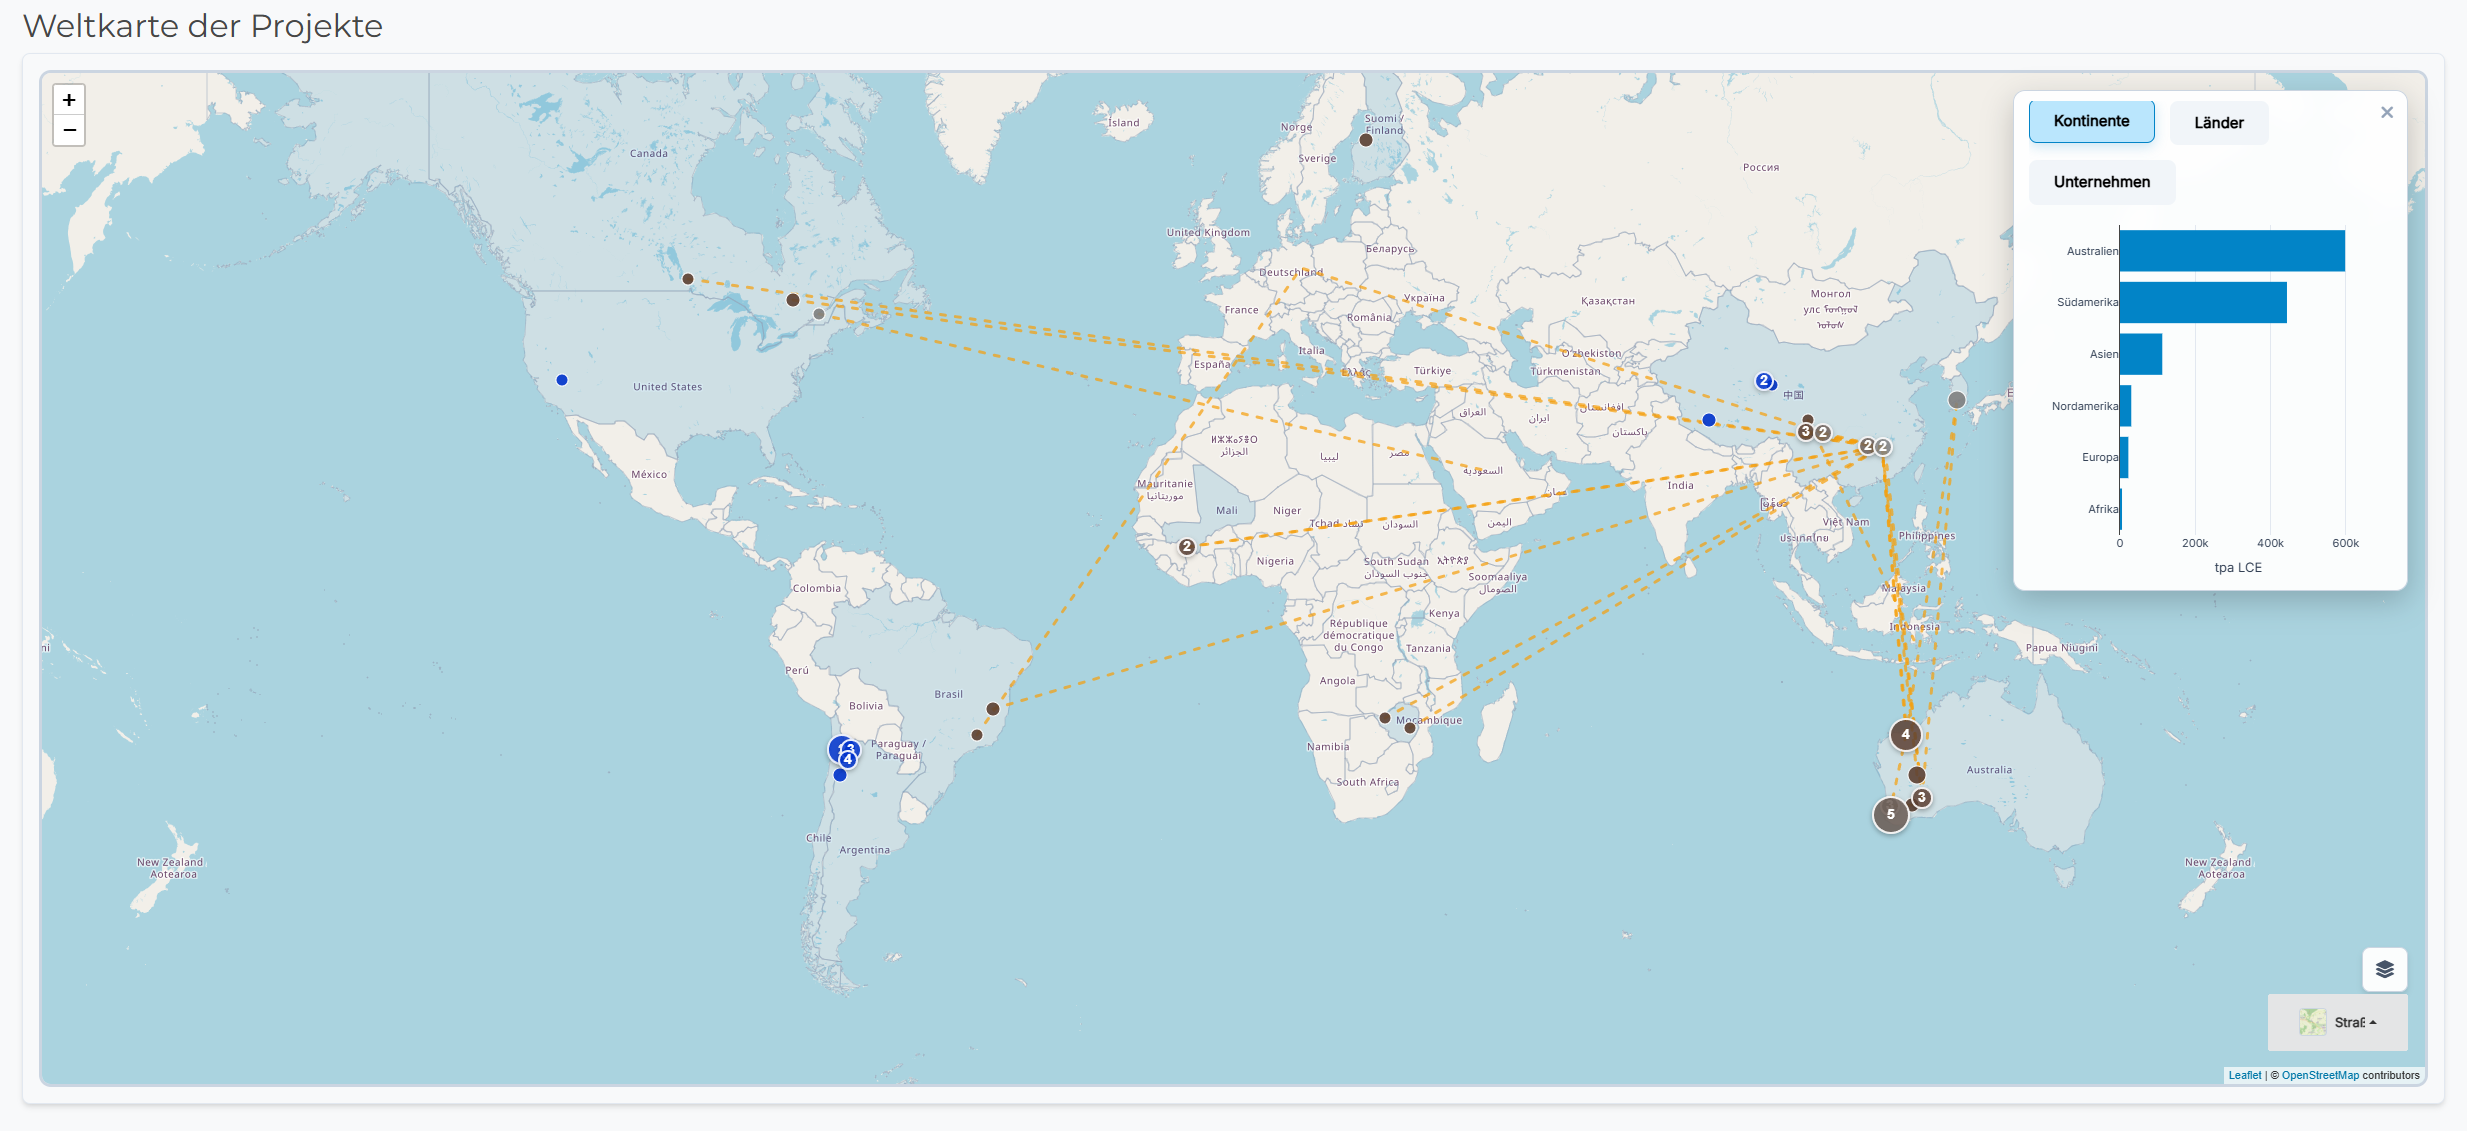
An interactive world map of every relevant lithium project — combined with dashboards that re-aggregate on the fly by continent, country or company. Pick a country and you see which projects sit there. Pick a company and you see where it's headquartered and which projects belong to its portfolio.

  • Dashboards per continent or country — projects, resources, extraction type
  • Company view: headquarters, project portfolio, stakes
  • Processing logistics overlay — which mine ships its ore to which converter
  • Filter by extraction type and development phase
  • Marker size = relative resource
World map of all lithium projects in the Compass
Click image to enlarge
02 · Bird's-eye View

From a dot on the map
straight to the mine.

A genuinely cool map feature: zoom in on a project marker and you land on a high-resolution satellite cut-out of the actual operation. You see salar evaporation ponds from above, hard-rock open pits, processing plants — lithium as physical infrastructure, not just a data point.

  • Brine projects: salar evaporation ponds in South America
  • Hard-rock operations: open pits in Australia & Canada
  • Direct Lithium Extraction (DLE) pilot plants
Hard-rock mine from bird's-eye view
Example: hard-rock pit · click to enlarge
Brine project from bird's-eye view
Example: salar evaporation ponds · click to enlarge
03 · Financial Model

P&L waterfall
& cashflow calculator.

From spot price down to net income — the waterfall shows every step of the profit-and-loss statement at project and company level. Next to it sits an interactive cashflow calculator: set production cost, tax rate, capex — and instantly see how free cashflow reacts.

  • P&L waterfall: revenue → EBITDA → EBIT → net
  • Cashflow calculator with custom AISC, capex and tax-rate inputs
  • Compare spot-price scenarios side by side
  • Per project & aggregated to company level
P&L waterfall and cashflow calculator
Click to enlarge
04 · Valuation

P/E comparison
in sector context.

Who's over-, who's undervalued? The P/E comparison puts the companies side by side — relative to the sector mean and with historical ranges as context.

  • Sector mean as reference line
  • Historical min/max range per company
  • Sort by cap, margin, growth
P/E comparison in the Compass
Click to enlarge
05 · Price Targets

Price targets from
real data.

The model derives theoretical price targets per company from current spot prices, production costs and standard P/E multiples — fully transparent, every lever visible.

  • Run different spot-price scenarios
  • Per project: resource, AISC, margin
  • Sort by leverage, cap or upside
Price target overview in the Compass
Overview · click to enlarge
Price targets at project level
Project level · click to enlarge
06 · Methodology & Assumptions

Assumptions
on the table.

No black box. Every parameter — spot-price assumptions, FX, margin expectations, multiples — is visible and adjustable inside the tool itself. Where no precise per-company figures are available, realistic example values are filled in, assigned by quartile sorting across continent and company size (scale effects) — visible in the assumptions tab of the tool.

  • Defaults as starting point, override at will
  • Quartiles per continent & size class (scale effects considered)
  • Save your own scenarios
  • Sources for spot prices and sector multiples documented
Disclaimer: no guarantee. The values and price targets produced by the tool are expressly without warranty — they illustrate one possible calculation logic and are largely estimated. Where companies do not publish reliable per-project numbers, realistic example values are substituted via quartile sorting (continent · size). Treat the output as an idea for a valuation, not a binding forecast. Please also see the privacy notice and our risk disclaimer in the footer.
Assumptions overview in the Compass
Quartile assumptions · click to enlarge

Ready to navigate?

The tool opens in the live R-Shiny environment. Set filters, tweak assumptions, calculate price targets.

Launch the Compass →